Customer_support_intelligence
Customer Support Intelligence EDA System
App: https://customersupportintelligence.streamlit.app/
Overview
Customer support has always been a challenging yet crucial aspect of any business—it’s what makes or breaks customer trust. As companies scale, the volume of customer interactions increases exponentially, making efficient customer service a key differentiator.
The motivation behind this project is to explore how businesses can provide the best and most efficient customer service at scale. When the number of customers grows, so does the complexity of handling their inquiries and issues. Effective customer service can make or break a company’s reputation and long-term success.
In this project, we analyze customer support interactions by examining tweets from different customers, measuring response times, and evaluating how some of the top companies handle customer service. Our goal is to understand how customer support efficiency impacts business outcomes and identify ways AI can enhance the support experience.
DataSet
import kagglehub

# Download latest version
path = kagglehub.dataset_download("thoughtvector/customer-support-on-twitter")

print("Path to dataset files:", path)
Exploratory Data Analysis
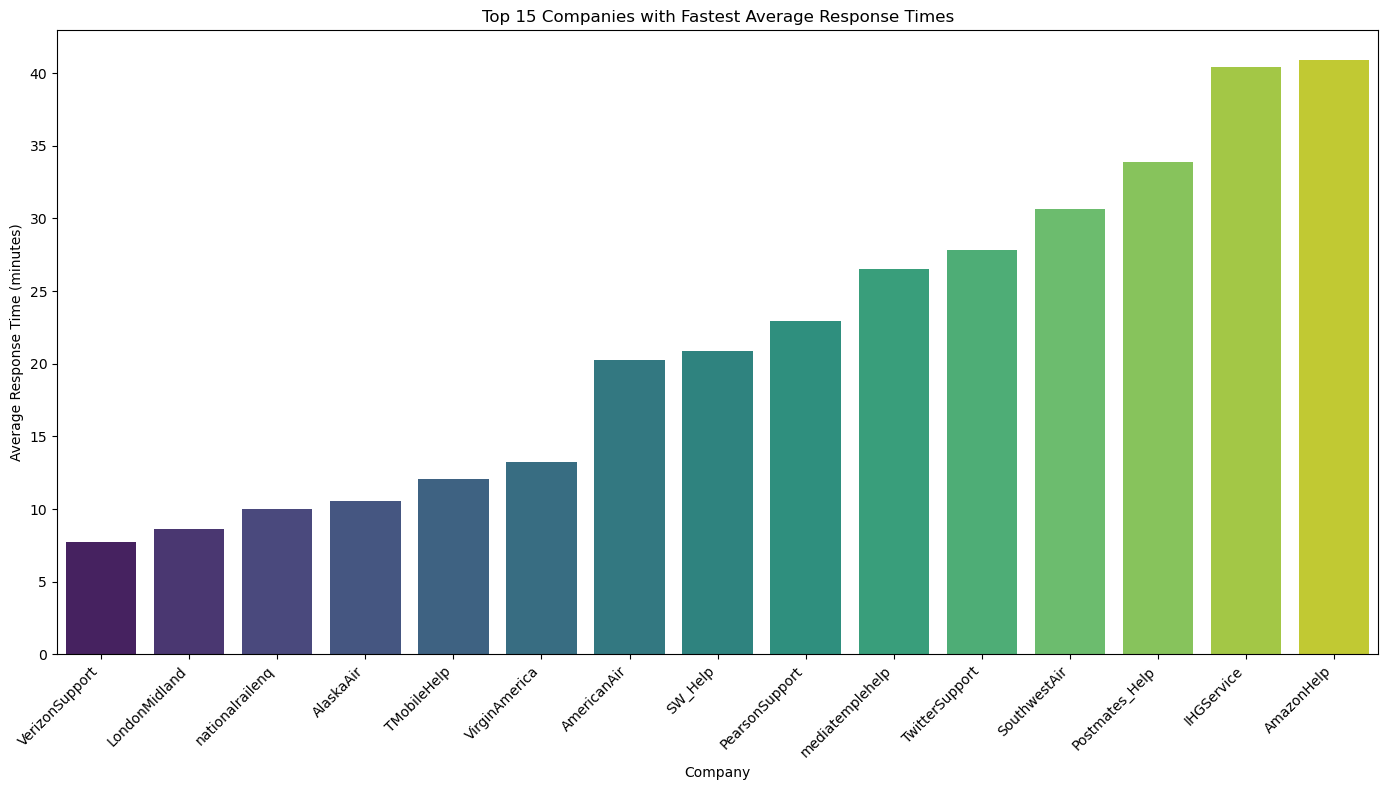
Company Response Time Analysis
This document presents two sets of data: one for companies with faster response times and one for companies with slower response times.
Companies with Fast Response Times
| author_id | response_count | avg_response_time (mins) | median_response_time (mins) |
|---|---|---|---|
| VerizonSupport | 17805 | 7.74 | 3.30 |
| LondonMidland | 6515 | 8.67 | 4.62 |
| nationalrailenq | 4135 | 9.98 | 5.43 |
| AlaskaAir | 7414 | 10.57 | 3.50 |
| TMobileHelp | 34229 | 12.06 | 2.75 |
| VirginAmerica | 2802 | 13.27 | 3.62 |
| AmericanAir | 36531 | 20.27 | 10.73 |
| SW_Help | 11775 | 20.88 | 6.57 |
| PearsonSupport | 824 | 22.96 | 9.40 |
| mediatemplehelp | 302 | 26.49 | 7.98 |
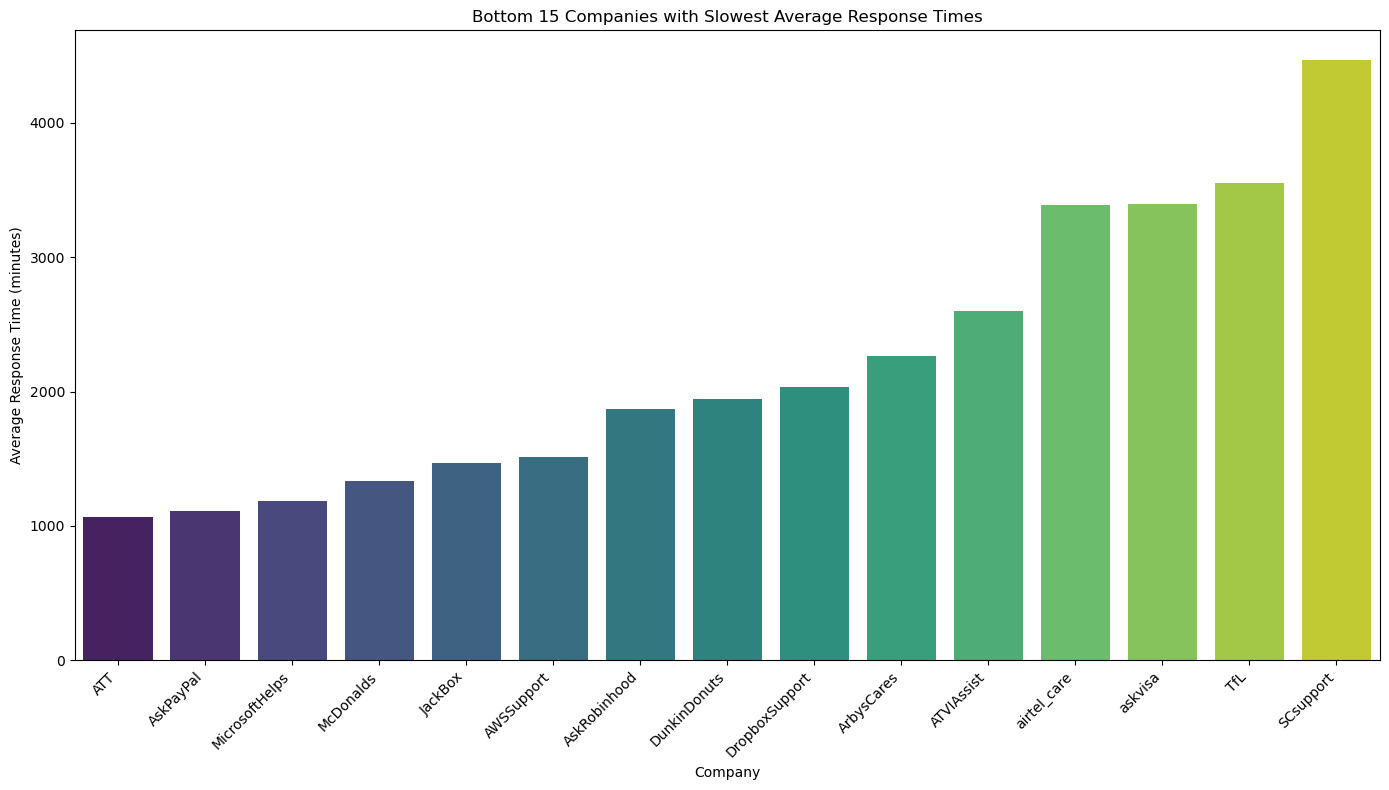
Companies with Slow Response Times
| author_id | response_count | avg_response_time (mins) | median_response_time (mins) |
|---|---|---|---|
| AWSSupport | 1034 | 1514.41 | 151.28 |
| AskRobinhood | 430 | 1867.25 | 785.77 |
| DunkinDonuts | 1278 | 1946.27 | 1331.42 |
| DropboxSupport | 5940 | 2036.13 | 1387.43 |
| ArbysCares | 1904 | 2266.14 | 1057.63 |
| ATVIAssist | 17518 | 2599.39 | 362.11 |
| airtel_care | 9866 | 3390.29 | 693.34 |
| askvisa | 709 | 3397.09 | 2983.85 |
| TfL | 2218 | 3552.91 | 37.80 |
| SCsupport | 1250 | 4465.22 | 3973.38 |
Companies with Highest Response Volumes
| author_id | response_count | avg_response_time (mins) | median_response_time (mins) |
|---|---|---|---|
| AmazonHelp | 168823 | 40.90 | 11.47 |
| AppleSupport | 106648 | 147.36 | 70.97 |
| Uber_Support | 56193 | 95.57 | 8.87 |
| SpotifyCares | 43206 | 186.85 | 43.95 |
| Delta | 42149 | 182.52 | 10.18 |
| Tesco | 38470 | 239.80 | 96.71 |
| AmericanAir | 36531 | 20.27 | 10.73 |
| TMobileHelp | 34229 | 12.06 | 2.75 |
| comcastcares | 32975 | 192.75 | 29.28 |
| British_Airways | 29291 | 253.15 | 180.50 |
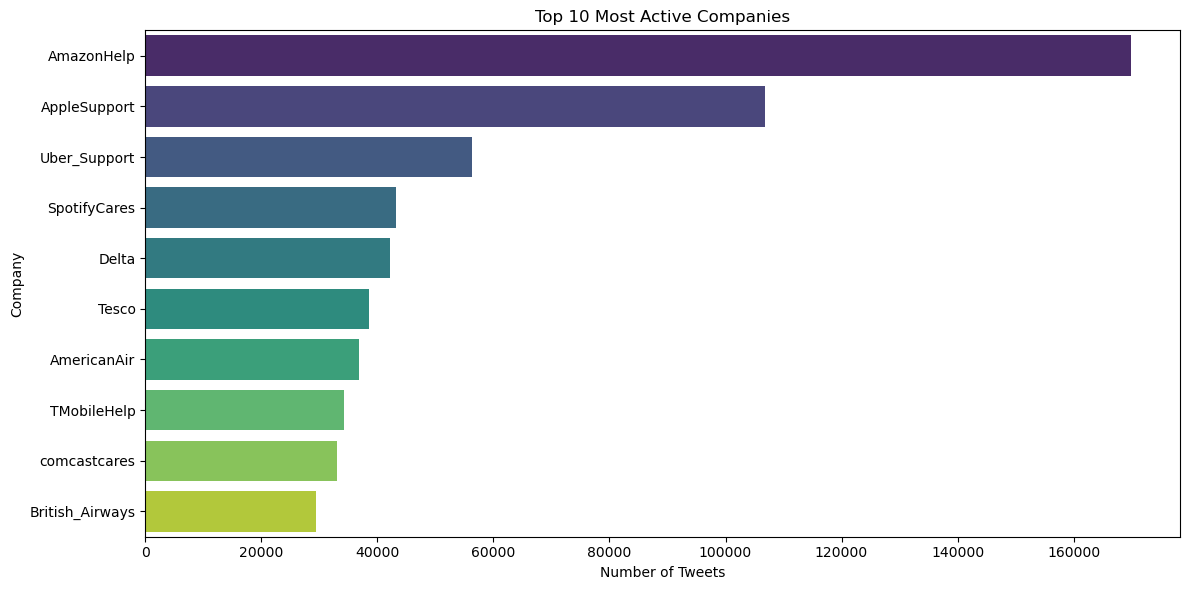
Top Companies by Tweet Count
| author_id | tweet_count |
|---|---|
| AmazonHelp | 169,840 |
| AppleSupport | 106,860 |
| Uber_Support | 56,270 |
| SpotifyCares | 43,265 |
| Delta | 42,253 |
| Tesco | 38,573 |
| AmericanAir | 36,764 |
| TMobileHelp | 34,317 |
| comcastcares | 33,031 |
| British_Airways | 29,361 |
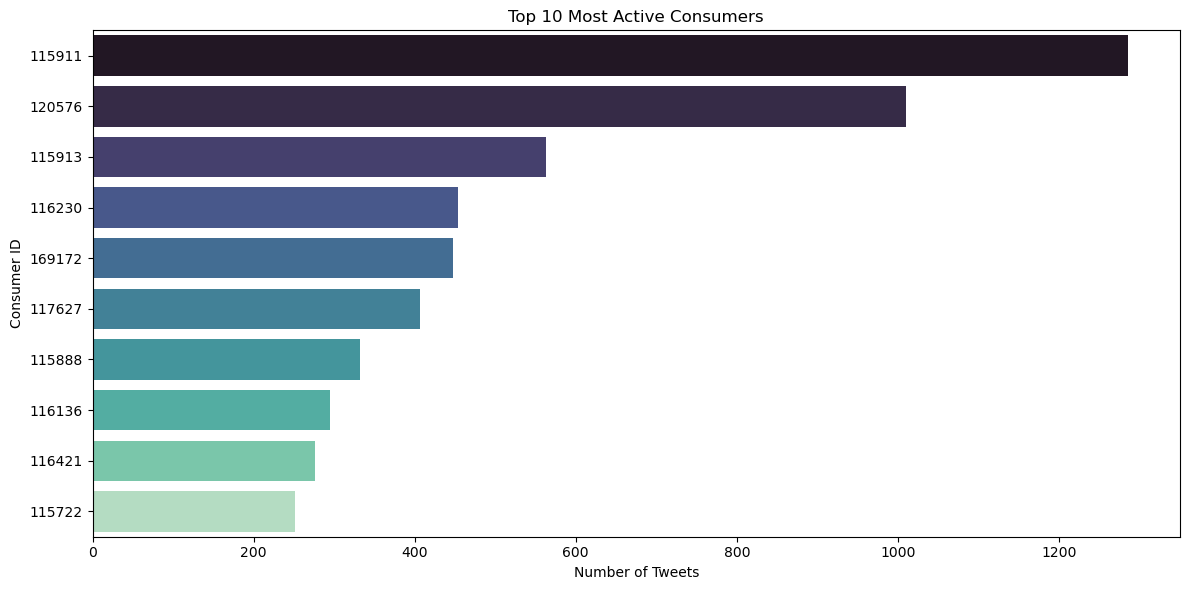
Top Consumers by Tweet Count
| author_id | tweet_count |
|---|---|
| 115911 | 1,286 |
| 120576 | 1,010 |
| 115913 | 563 |
| 116230 | 454 |
| 169172 | 448 |
| 117627 | 406 |
| 115888 | 332 |
| 116136 | 295 |
| 116421 | 276 |
| 115722 | 252 |
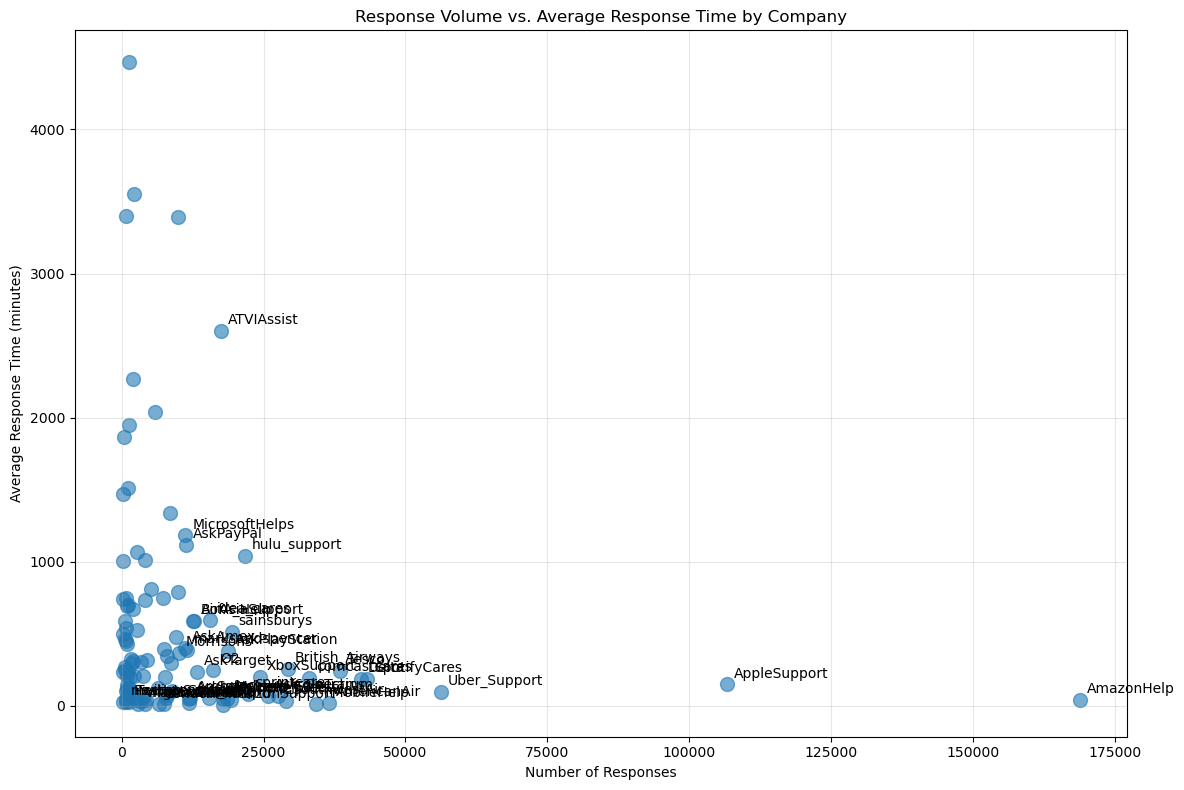
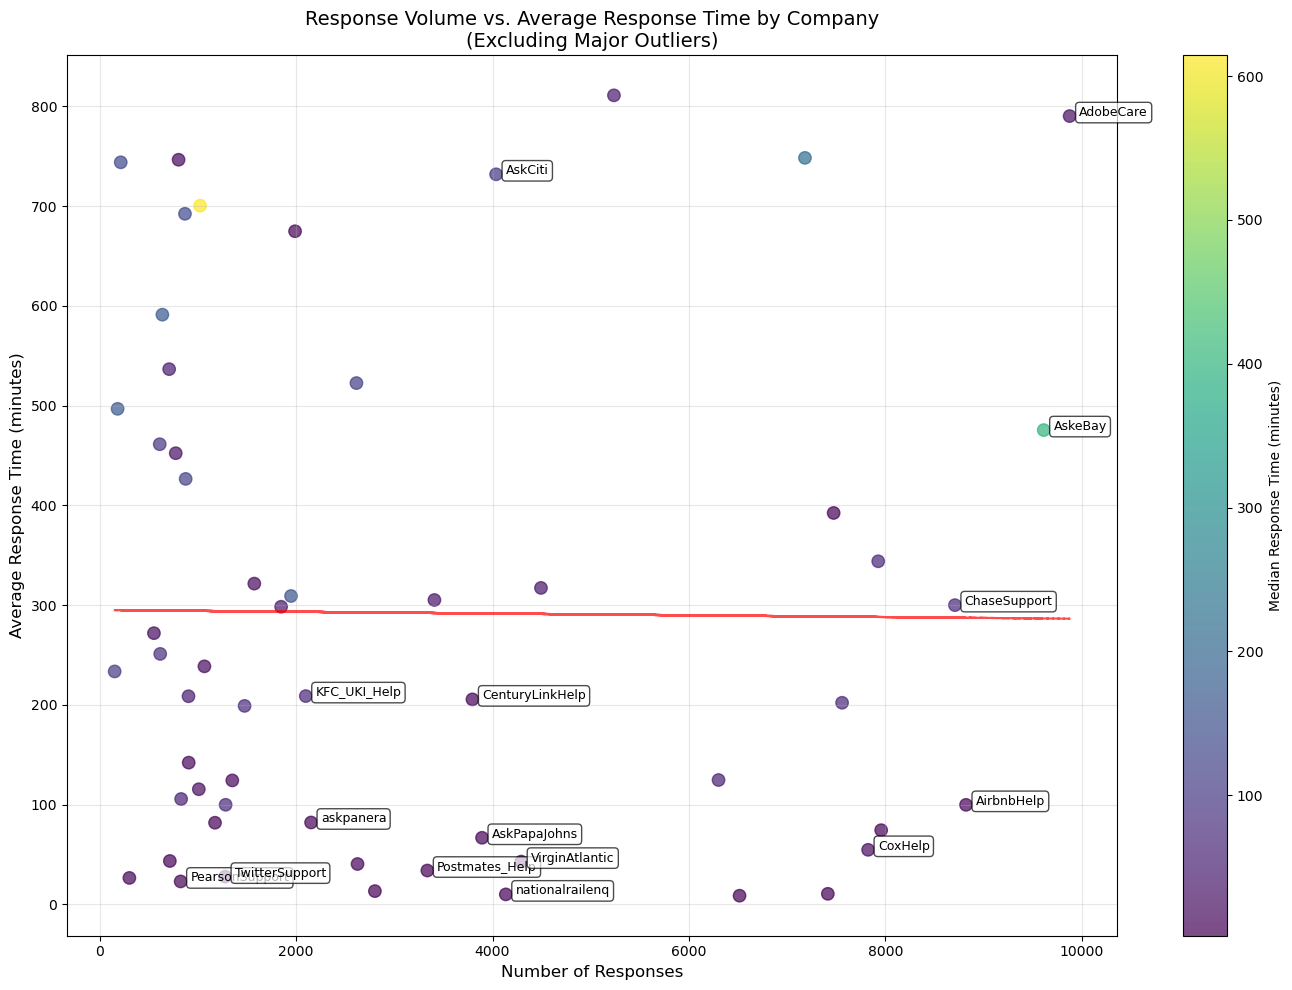
Summary of Insights from Scatter Plots & Customer Support Analysis
-
Response Volume vs. Response Time • AmazonHelp and AppleSupport efficiently handle high response volumes while maintaining low response times. • ATVIAssist, MicrosoftHelps, AdobeCare, and AskCiti struggle with longer response times despite lower interaction volumes, suggesting inefficiencies.
-
Most Active Companies & Consumers • AmazonHelp, AppleSupport, and Uber_Support dominate in customer engagement, leveraging social media for proactive support. • A few individual consumers show extremely high activity, possibly representing frequent complainers, influencers, or high-profile customers.
-
Tweet Activity Distribution (Companies vs. Consumers) • Companies generate significantly higher tweet volumes than consumers, indicating proactive engagement in social media support. • Outliers like AmazonHelp and AppleSupport highlight an extensive, structured approach to customer support.
Inferences • High-volume companies (Amazon, Apple, Uber) effectively scale social media support with well-optimized strategies. • Companies with lower volumes but high response times need process improvements to enhance responsiveness. • A small group of highly active consumers may present targeted engagement opportunities.
Recommendations
✅ Optimize Customer Support Operations: Low-performing companies should analyze high-efficiency models (Amazon, Apple) to implement best practices. ✅ Engage Highly Active Customers: Convert frequent interactions into positive brand advocacy through proactive engagement. ✅ Leverage AI & Automation: Implement automated triaging, chatbots, and sentiment analysis to streamline responses and improve efficiency.
Key Features
Data Analysis & Insights
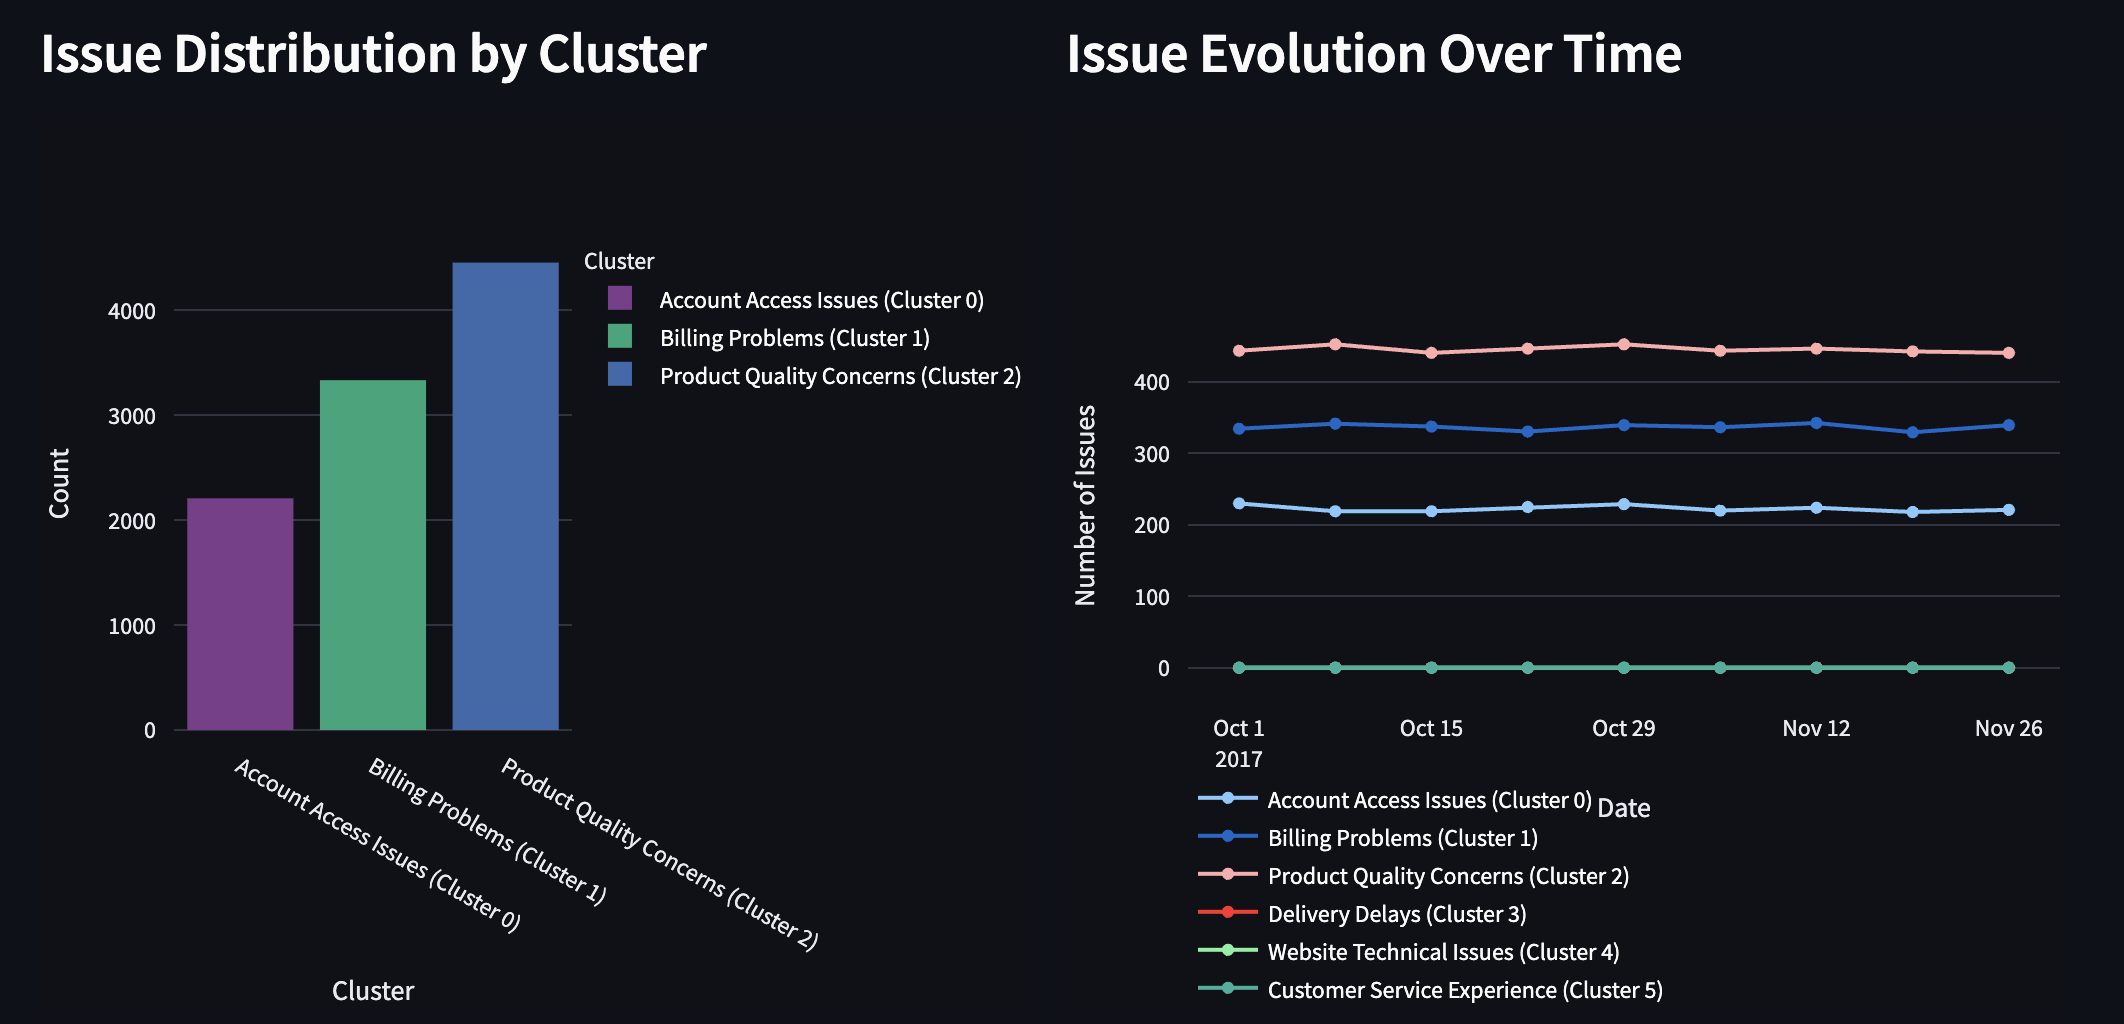
- Root Cause Analysis: Identify underlying causes of customer issues through NLP-based semantic clustering.
- Trend Tracking: Monitor how problem patterns evolve over time.
- Solution Recommendation: Suggest solutions based on historical resolution data.
- Issue Clustering: Group semantically similar customer problems using AI-driven embeddings.
Technical Implementation
- Batch Embedding Generation: Process large datasets efficiently with rate limiter protection.
- Gemini AI Integration: Enhanced analysis and recommendations using Google’s Gemini API.
- NLP-Based Clustering: Group customer support tickets using advanced semantic analysis.
- Interactive Streamlit UI: User-friendly interface for exploring and utilizing insights.

Dataset
This project utilizes the Kaggle Customer Support Dataset, containing over 3 million customer support tweets from major brands.
System Architecture
- Data Processing Pipeline:
- Text cleaning and normalization
- Batch embedding generation with rate limiting
- Semantic clustering of support issues
- Analysis Engine:
- Topic identification across customer issues
- Time-series analysis of issue patterns
- Escalation prediction modeling
- User Interface:
- Interactive dashboard for issue overview
- Issue classifier for new support tickets
- Solution recommender for support agents
- Trend analysis with AI-powered insights
Setup Instructions
Prerequisites
- Python 3.9+
- Gemini API key
Installation
- Clone the repository:
git clone https://github.com/your-repo/customer-support-intelligence.git cd customer-support-intelligence - Install dependencies:
pip install -r requirements.txt - Create a
.envfile with your Gemini API key:echo "GEMINI_API_KEY=your_api_key_here" > .env - Run the Streamlit app:
streamlit run app.py
Usage
Dashboard
- View the overall distribution of customer issues and track trends over time.
Issue Classifier
- Enter a new customer issue to classify it into the appropriate category.
Similar Issues Finder
- Find semantically similar past issues to reference previous resolutions.
Solution Recommender
- Get AI-powered solution recommendations for specific customer problems.
Trend Analysis
- Analyze how customer issues evolve over time with AI-generated insights.
Technical Details
Embedding Process
The system uses a batch processing approach with rate limiting to generate embeddings from the Gemini API:
- Batch Size: 40 items per request
- Rate Limiting: Respects API constraints (up to 1200 RPM)
- Persistence: Saves embeddings to allow incremental processing
- Error Handling: Robust error management and progress tracking
Clustering Methodology
Customer issues are clustered using:
- Dimensionality Reduction: UMAP for visualization
- Clustering Algorithm: K-means with optimal cluster determination
- Similarity Metrics: Cosine similarity for semantic matching
Future Enhancements
- Integration with ticketing systems for real-time analysis.
- Sentiment analysis for customer satisfaction tracking.
- Automated escalation routing based on issue classification.
- Multi-language support for global customer bases.
Architecture

License
This project is licensed under the MIT License - see the LICENSE file for details.
Acknowledgments
- Kaggle Customer Support Dataset for providing the data.
- Google Gemini API for enhanced natural language processing capabilities.
- Streamlit for the interactive web application framework.